Exercise #9 |
Additional Aircraft Sampling Data
- Load conc_case_control.txt and conc_case_setup.txt
- Aircraft sample collected around 0100
- Configure for average concentration from 0100-0200
- Run model simulation for 9 hours
Plot the model plume and aircraft data
Compare new result
With previous result
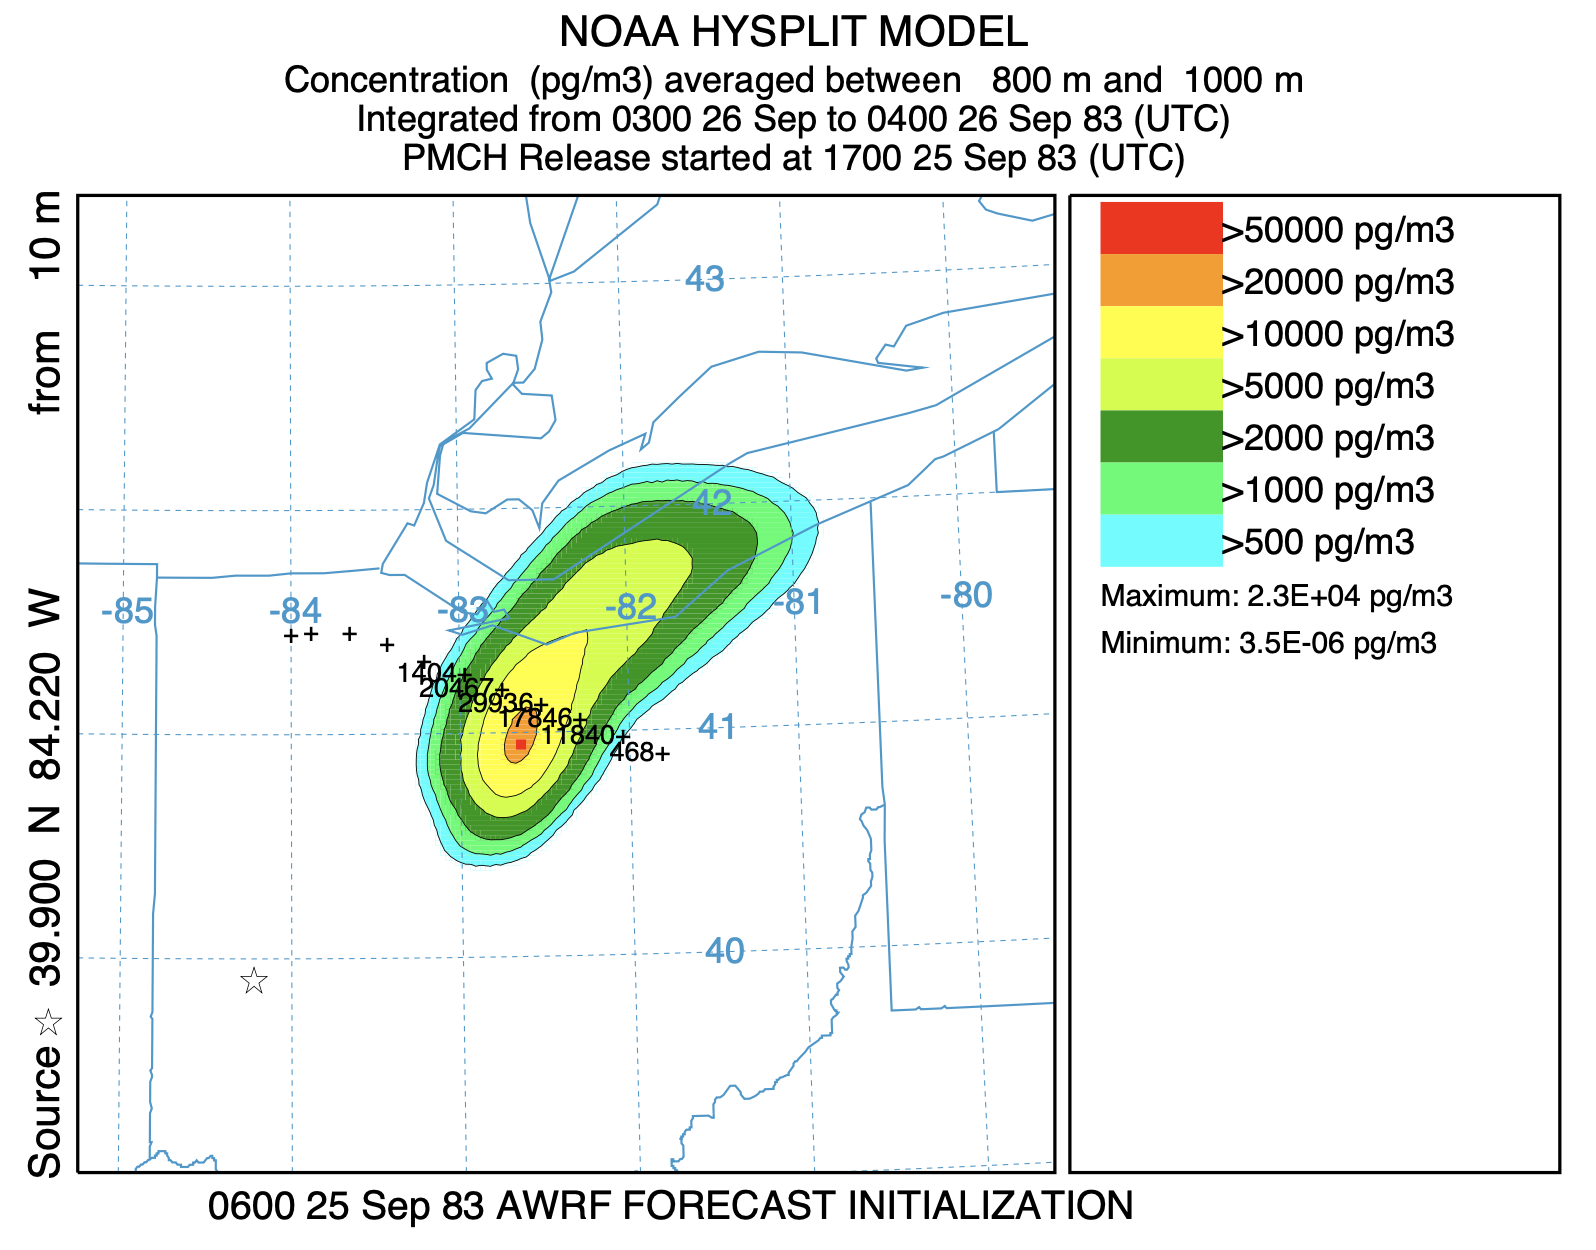
The earlier aircraft pass was approximately along the same sampling path and the calculation results show that the main plume (highest concentrations) has not yet reached the sampling line. The model results suggest that over the next two hours the plume position will shift to the east and the northeast along the plume axis.
Concentration Profile at Location of Maximum
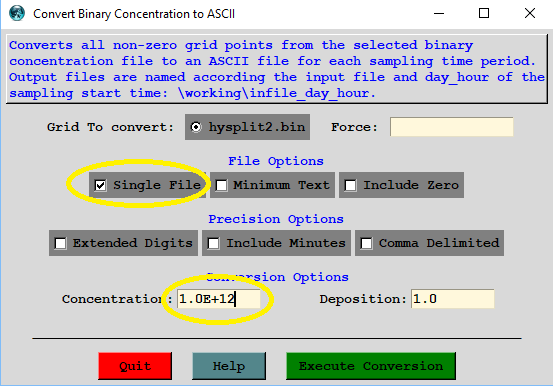
- Load conc_case_control.txt and conc_case_setup.txt
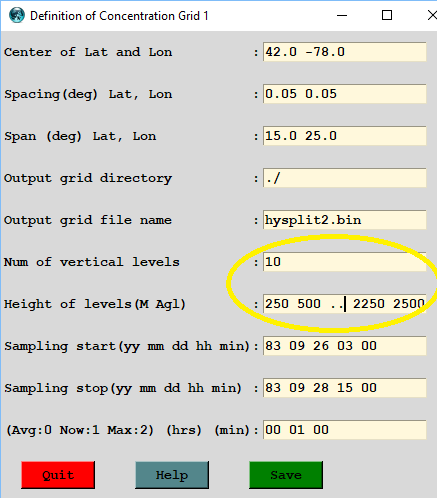
- Set 10 levels: 250 500 750 1000 1250 1500 1750 2000 2250 2500
Display plots for each level
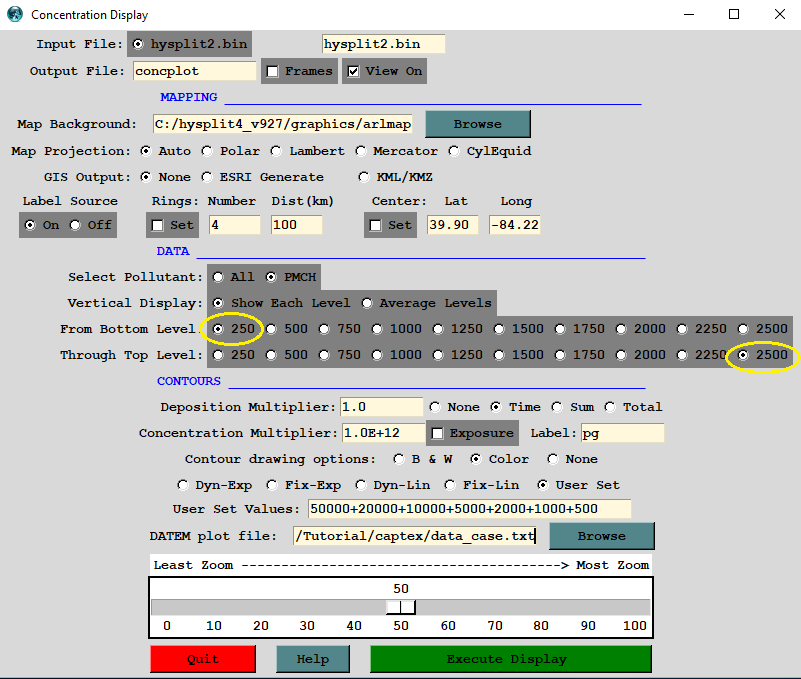
Extract Profile at: 41.1 and -82.5
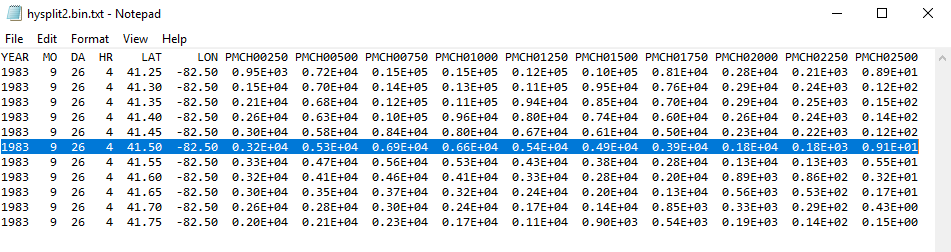
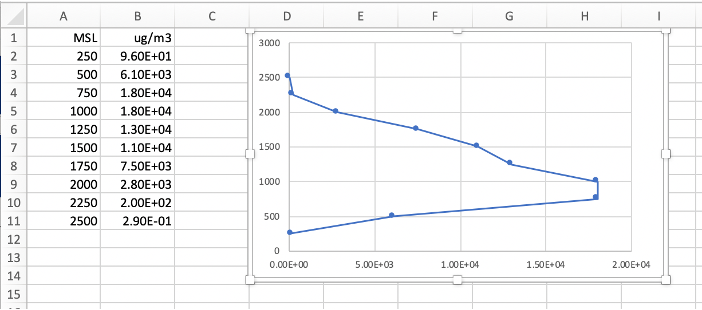
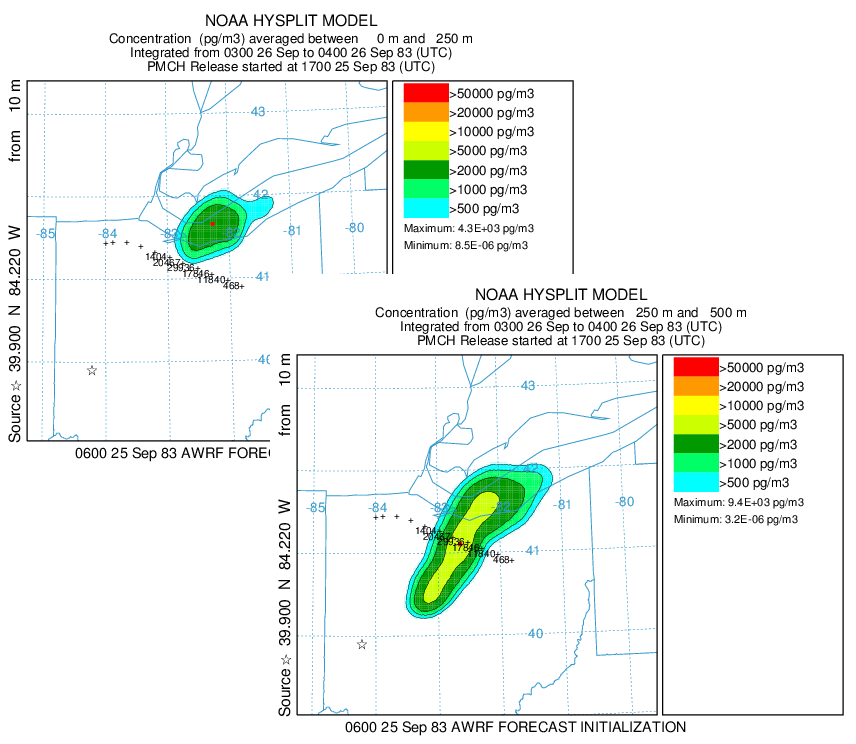
The plume display by level shows the faster and more clockwise transport at the higher elevations. The lowest level (<250 m MSL) shows a pattern inconsistent with the other levels because the average terrain in that region is 300 m MSL and therefore no plume is calculated in the 0-250 m MSL layer until the terrain drops below 250 m which is closer to Lake Erie.
Mass Profile from MESSAGE file after 12 h