- When a time step of less than 1 min is required, a code section is invoked
to linearly interpolate the particle positions to the concentration grid
- Another option is to use puff rather than particle dispersion to reduce
artificial diffusion


13 10 18 19 | start time |
43.59066 -112.9380 10.0 | start location |
3 | run duration |
sage5_wrf01.bin | meteorology |
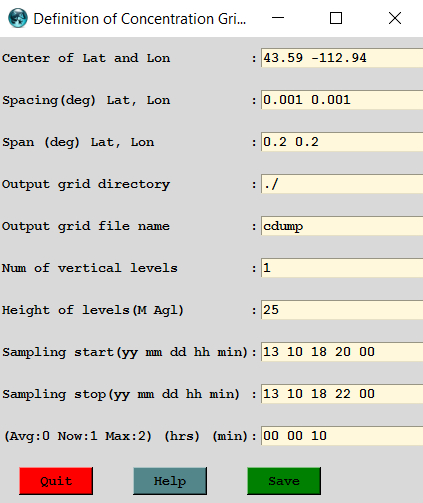
43.59 -112.94 | grid center |
0.001 0.001 | grid spacing |
0.2 0.2 | span |
25 | layer depth |
13 10 18 20 00 | sample start |
13 10 18 22 00 | sample stop |
00 00 10 | three hour averages |

SF6E | pollutant |
3708.0 | release rate |
2.5 | duration |
13 10 18 19 30 | release start |

numpar = 50000 | namelist particle release number |
maxpar = 100000 | namelist particle release maximum |

ichem = 6 | namelist divide mass by air density |

sage5_meas.txt | measured data file |
1.986E+08 | convert g/kg to ppt |
sage5.txt | output text file name |

Concentration Display Options

5 1 | rings distance |
1.986E+08 | convert g/kg to ppt |
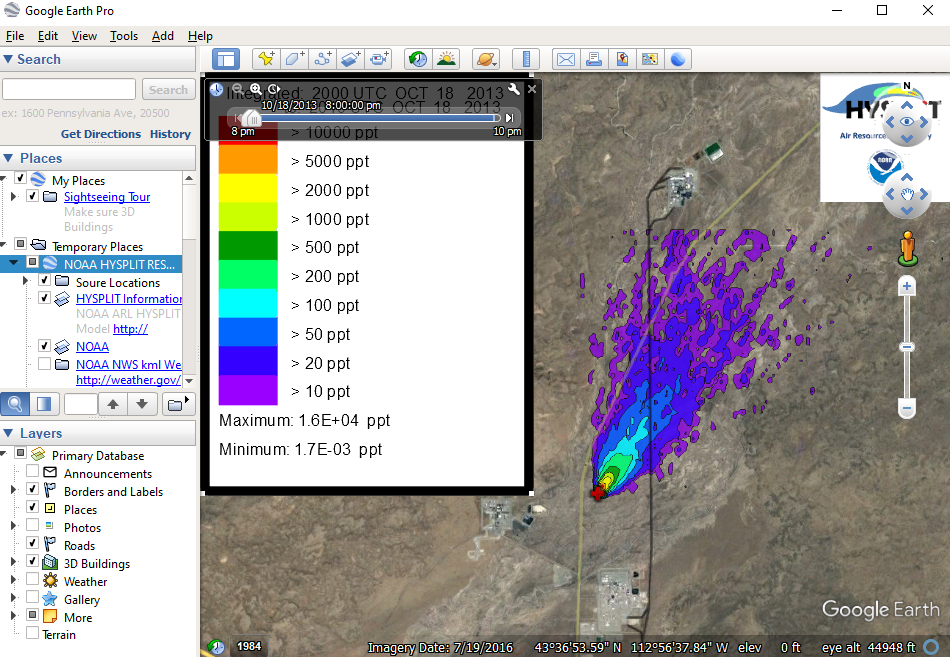
10000 ... 10 | user set contours |
100 | zoom factor |
sage5_meas.txt | measured data |
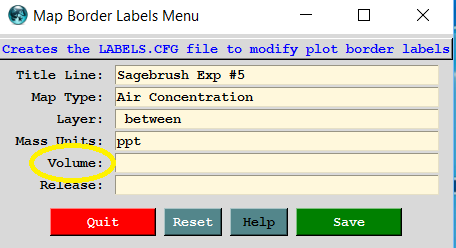
ppt | units label |
between | convert g/kg to ppt |
| volume = blanks |
sage5_meas.txt | measured data |

sage5_control.txt | save control file |
sage5_setup.txt | save setup file |
|